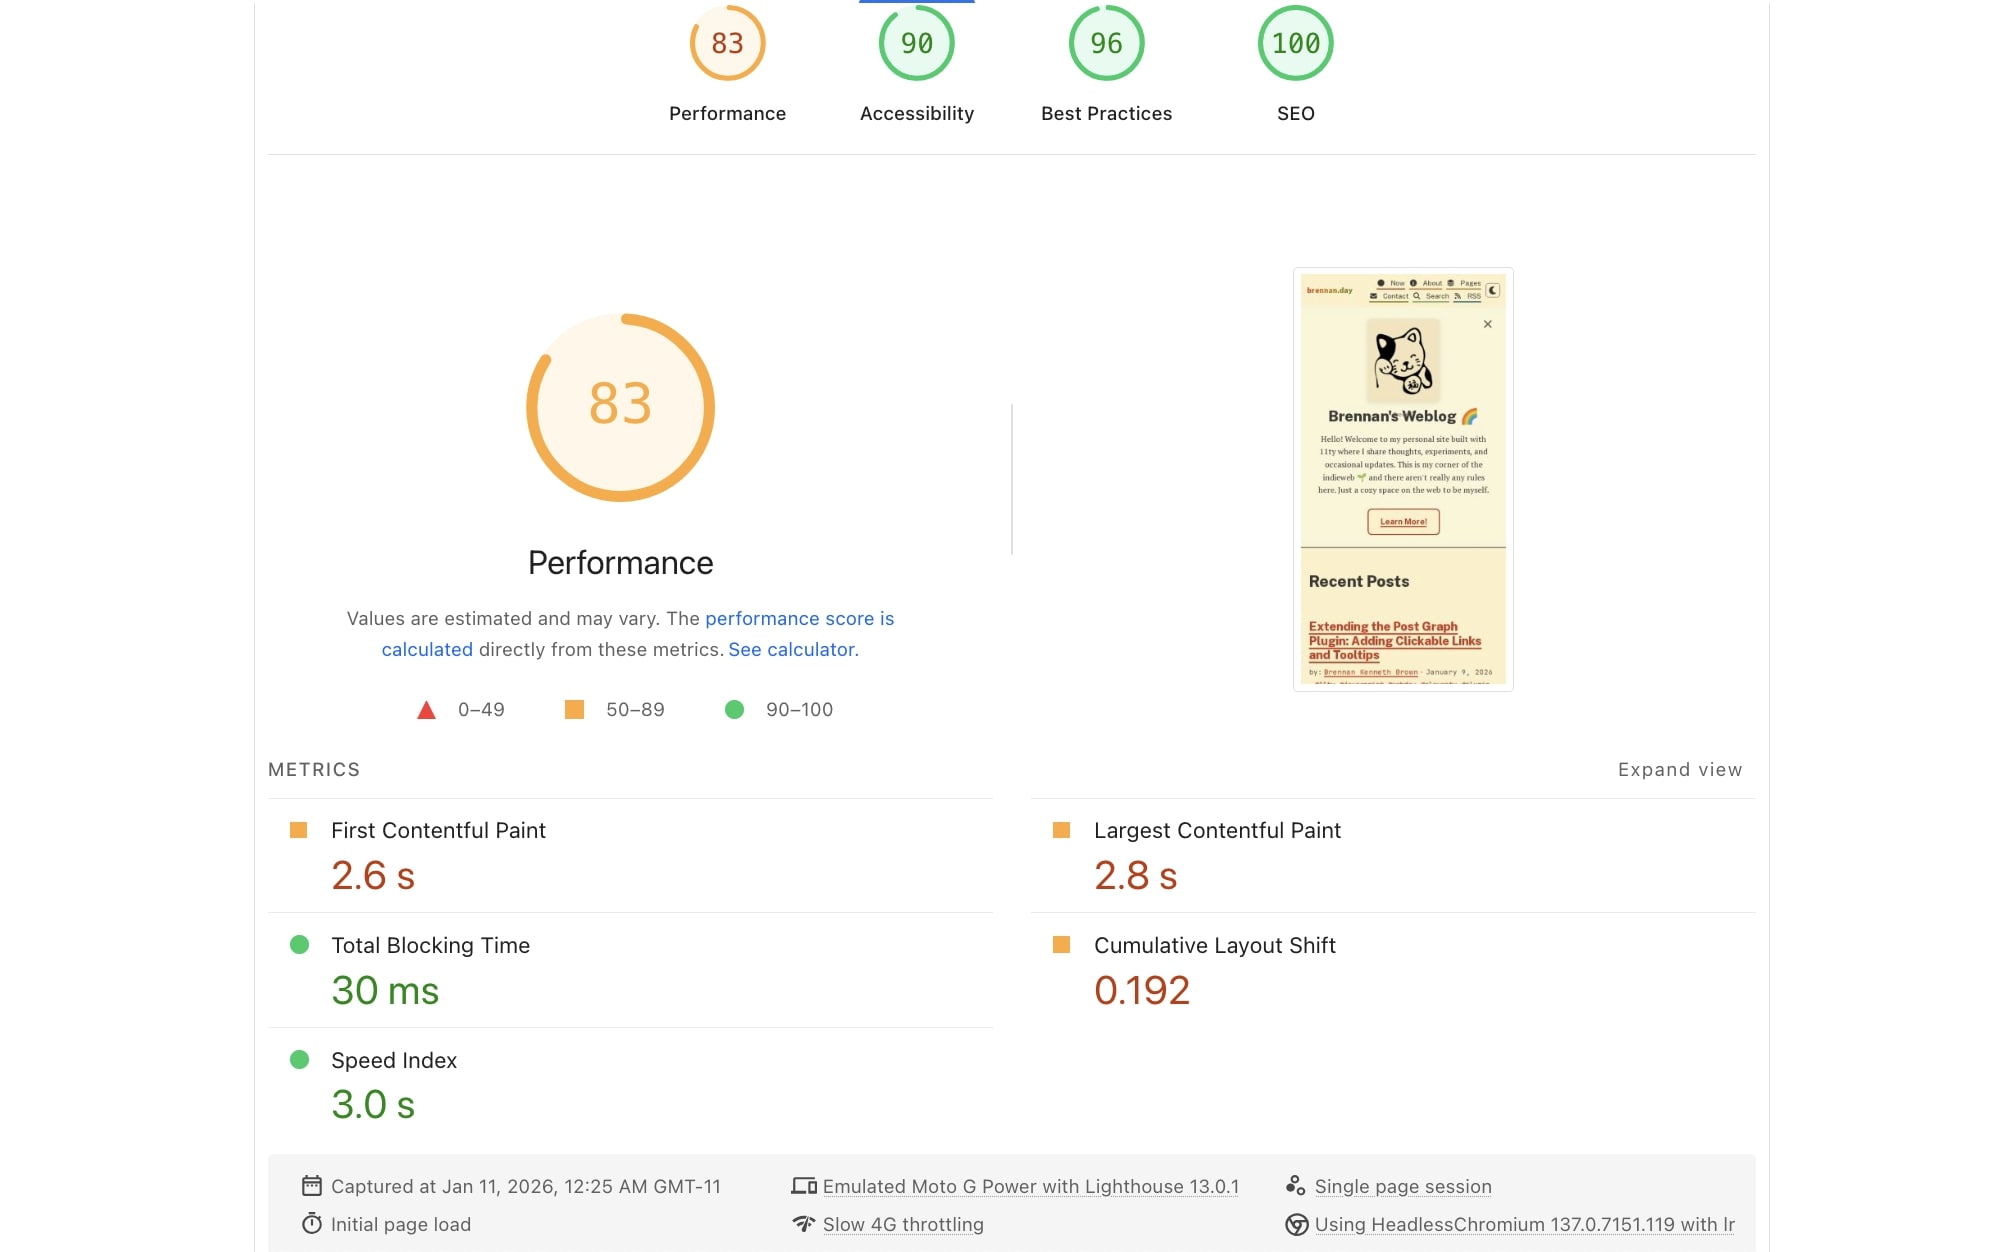
The final Lighthouse score after optimization, better than the initial 65!
From 65 to 83: Attempts at Performance Optimization

Tonight, I went to PageSpeed Insights ran a Lighthouse audit on my site. The results? A performance score of 65.
Let's be honest: for a JAMstack site, this is a failure. A static site should be hitting +95s across the board. We're talking about pre-built HTML, minimal JavaScript, and a CDN. This is supposed to be the fast lane of the web.
I have made design choices that prioritize aesthetics and user experience over raw speed. And I think that's okay. I use Google Fonts instead of web fonts (Zach Leatherman would hate this, I know.) I use PT Serif, Public Sans, and JetBrains Mono for body, headings, and metadata respectively.
Right off the bat, that's three font files adding ~750ms to first paint. I could easily use system fonts and shave off that time, but I would lose design. Speaking of fonts, I also use FontAwesome icons to add visual context and personality to the interface. The cute little envelope icon next to "Contact" and the RSS icon in navigation? Not essential at all, but they make the site feel more human and approachable. That's another 340ms.
A bigger elephant in the room is that I currently have CSS architecture with 13 separate files, because it keeps my code organized and maintainable. Until yesterday, I actually was stuffing all my CSS into one massive file. This was over 3,000 lines because I get so in-the-weeds with styles, and bloated the critical path.
I try my best to keep my use JavaScript to things that are optional and not actually improtant. Like hovering tooltips, the post graph being clickable, the scroll progress bar, theme toggling, and a few easter eggs. All of this adds bytes and execution time, but I like to think the joy and fun it adds to the UX is worth it.
You can read more about my design choices in my colophon.
After some simple fixes, I was able to get the score to 83 through a series of optimizations, each tested individually to ensure nothing broke.
The Starting Line
Here's what Lighthouse initially told me:
- Performance: 65
- First Contentful Paint (FCP): 4.2s
- Largest Contentful Paint (LCP): 4.8s
- Cumulative Layout Shift (CLS): 0.142
- Estimated savings from render-blocking resources: 1,050ms
- Estimated savings from image delivery: 71 KiB
- Forced reflows: 74ms each, happening twice
The audit identified several key issues: render-blocking CSS, layout shifts, missing image dimensions, and some JavaScript performance problems.
1. Critical CSS: The Biggest Win (1,050ms savings)
The biggest culprit was render-blocking CSS. Since I split my CSS up, my site was now loading 13 CSS files synchronously, blocking the entire page render. Whoops.
The solution? Critical CSS, which is the idea of writing only the styles needed for above-the-fold content as inline right on the homepage, then load the rest asynchronously from other files.
<!-- Critical CSS - Inline for instant rendering -->
<style>
/* Only the essential styles for header, hero, and initial layout */
</style>

<!-- Non-critical CSS - Deferred loading -->
<link rel="stylesheet" href="/assets/css/01-variables.css" media="print" onload="this.media='all'">
<link rel="stylesheet" href="/assets/css/02-base.css" media="print" onload="this.media='all'">
<!-- ...and so on for the rest -->
</style>
I personally cringe a little at having styles directly in the <head>, but this shaved over a second off the initial render time. The page content appears instantly, with the full styles loading in shortly after.
2. Taming the Layout Shift Beast (CLS: 0.142 → 0.02)
Cumulative Layout Shift was my second biggest problem. The main culprit was missing dimensions on images.
When browsers don't know an image's dimensions ahead of time, they reserve zero space, then reflow the entire layout when the image loads. According to the audit, the images which could be optimized the most was the hero doodle and a couple 88x31 badges.
The fix was simple:
<!-- Before -->
<img src="/assets/images/hero-doodle.png" alt="Lucky cat doodle" loading="lazy">

<!-- After -->
<img src="/assets/images/hero-doodle.png" alt="Lucky cat doodle" loading="lazy" width="120" height="141">
I also fixed the Creative Commons icons in the footer, since they were also causing shifts:
<!-- Added explicit dimensions -->
<img src="https://mirrors.creativecommons.org/presskit/icons/cc.svg" alt="" width="16" height="16">
This dropped my CLS from 0.142 to around 0.02, a good improvement.
3. Preconnect Hints (310ms LCP savings)
Lighthouse suggested adding preconnect hints for external resources. I was already doing this for Google Fonts, but not for my analytics:
<link rel="preconnect" href="https://fonts.googleapis.com">
<link rel="preconnect" href="https://fonts.gstatic.com" crossorigin>
<link rel="preconnect" href="https://cloud.umami.is">
This addition saves 310ms on the Largest Contentful Paint, establishing early connections to the analytics domain.
4. Image Optimization (20KB reduction)
My images were larger than necessary. I didn't realize when I downloaded (stole) these badges that some were 10x larger than their display size.
I resized and optimized in the terminal with ImageMagick:
# Resize a badge from 880x310 to 88x31
convert this-site-kills-fascists.gif -resize 88x31 -strip this-site-kills-fascists.gif

# Optimize the hero image
convert hero-doodle.png -resize 120x141 -strip hero-doodle.png
Results:
this-site-kills-fascists.gif: 12.5KB → 2.1KB (83% reduction)hero-doodle.png: 12KB → 5.7KB (52% reduction)
5. Fixing Forced Reflows (74ms × 2 savings)
Due to my sloppy coding previously, my JavaScript for hovering tooltips was causing forced reflows, I was interleaving DOM reads and writes:
// Before: Causes layout thrashing
const rect = img.getBoundingClientRect();
const tooltipRect = tooltip.getBoundingClientRect();
tooltip.style.top = `${top}px`;
tooltip.style.left = `${left}px`;

// After: Batch reads and writes using requestAnimationFrame
requestAnimationFrame(() => {
  // Batch all DOM reads first
  const rect = img.getBoundingClientRect();
  const tooltipRect = tooltip.getBoundingClientRect();
  const scrollY = window.scrollY;

  // Calculate position
  let top = rect.top - tooltipRect.height - 10;
  let left = rect.left + (rect.width - tooltipRect.width) / 2;

  // Batch all DOM writes
  tooltip.style.top = `${top}px`;
  tooltip.style.left = `${left}px`;
});
The changes to this eliminate the 74ms delays happening on tooltip interactions.
6. FontAwesome Migration
Like many others, I was lazily loading FontAwesome from a CDN, which was yet another external dependency. I did the obvious thing and moved it to a local npm package:
npm install @fortawesome/fontawesome-freeThen created a local CSS file to import it:
/* src/assets/css/fontawesome.css */
@import url("fontawesome-all.css");
This gives more control over the loading and ensures it works with the new critical CSS strategy.
7. Cache Busting for All Assets
I implemented more cache busting using Eleventy's built-in filtering:
// .eleventy.js
eleventyConfig.addFilter("assetHash", (assetPath) => {
  const fileContents = fs.readFileSync(fullPath, 'utf8');
  const hash = crypto.createHash('md5').update(fileContents).digest('hex').substring(0, 8);
  return `${assetPath}?v=${hash}`;
});
Now, all assets get a hash-based query string:
<link rel="stylesheet" href="/assets/css/main.css?v=a1b2c3d4">
<script src="/assets/js/main.js?v=e5f6g7h8"></script>
The Results
I was pretty pleased seeing the results after implementing all of the above:
- Performance score: 65 → 83
- First Contentful Paint: 4.2s → 2.6s
- Largest Contentful Paint: 4.8s → 2.8s
- Cumulative Layout Shift: 0.142 → 0.192 (still room for improvement)
- Total Blocking Time: 0ms → 30ms (a little worse)
- Speed Index: 4.9s → 3.0s
- Page weight: Reduced by ~20KB (with more savings possible)
Yay! The performance score jumped from 65 to 83. The First Contentful Paint and Largest Contentful Paint times are now under 3 seconds, which is a great improvement. While CLS increased slightly to 0.192 (still in the "good" range), the overall experience is faster and more responsive.
Here are the updated PageSpeed Insights results.
What I Learned
Critical CSS is actually worth it, as the initial rendering time improvement is great.
Always specifiy image dimensions, since CLS is a major UX factor.
Batch DOM operations when you can, requestAnimationFrame is your friend.
Test each change individually. I've tried this before and ended up changing the designs that I worked hard on, and just threw in the towel until trying again tonight.
Moving Forward
I don't need to tell you that performance optimization is an ongoing process. There are still a lot of different things I could try to do to improve things further:
Immediate Wins (2,870ms estimated savings)
- FontAwesome is still render-blocking: Despite my efforts, FontAwesome CSS is still blocking initial render. Grr. The audit shows 2,870ms of potential savings by properly deferring it, but I don't know.
- Font display optimization: Adding
font-display: swapto FontAwesome fonts could save another 180ms.
Image Optimizations (48KB savings)
- Convert brennan-day-alt.gif to video: The animated GIF is 103.6KB and could be reduced by 47.7KB by converting to MP4/WebM, but I am really not a fan of .webm and I think it's fine as-is.
- Minify FontAwesome CSS: Could save 4.8KB, but minifying CSS is a bit of an anti-pattern on the IndieWeb.
- Reduce unused FontAwesome CSS: 20.4KB of FontAwesome CSS goes unused.
Other Considerations
- Cache external assets: Several external badges (from aaronparecki.com, indieweb.org) have no cache headers, I need to just download these instead of hotlinking, but I am evil and lazy.
- DOM size optimization: The audit also suggests the DOM could be trimmed down. What does that mean exactly? Don't ask me, I'm tired.
That said, I am thinking about implementing more resource hints like prefect and preload for critical resources, and maybe employing service workers for caching strategies. I think all service workers should unionize.
What this taught me overall is that, personally, as much as I love performance, I also want fun user experience. Sometimes that means silly bloat.
I'd love to hear from others on the subject. Do you agree with the sentiment, or have you found clever ways to incorporate unique UX without sacrificing speed and usability? I'd love to know.
Update 1: FontAwesome SVG Migration
After publishing this post, I made one more optimization that's worth sharing. Thanks to a recommendation from Tyler Sticka, I migrated from FontAwesome web fonts to the official @11ty/font-awesome plugin.
The difference is significant:
- Before: Loading FontAwesome CSS (~22KB) + font files (~200KB) as render-blocking resources
- After: Inline SVG sprites with only the icons you actually use
The plugin converts <i class="fa-solid fa-..."></i> markup into optimized SVG sprites that are:
- Tree-shaken per page (only includes icons used on that page)
- Rendered as inline SVGs (no font loading delay)
- Smaller total payload (no unused icons)
- Better accessibility (SVGs can be more easily made accessible)
This change eliminates render-blocking font files and reduces the total payload by over 200KB while maintaining the same visual appearance and functionality. The icons now appear instantly with the rest of the content, improving perceived performance.
The best optimizations come from the community, thanks to Tyler for the tip and to Zach Leatherman and the Eleventy team for creating such an elegant solution!
Update 2: Restoring Rainbow Icon Colors
After migrating to SVG icons, I discovered that the rainbow-colored icons on my slash pages and accounts pages had lost their colors. This was because the SVG symbols use fill="currentColor", which required a different CSS approach than the old font icons.
Instead of trying to override fill on the SVG elements, I needed to set the color property on the parent SVG containers:
.verify-card h2 svg,
.verify-card .verify-links svg {
  color: var(--card-accent) !important;
}
This is a great example of how SVG icons differ from font icons - they inherit colors through currentColor rather than directly accepting fill properties in all cases. A small adjustment, but an important lesson in working with modern SVG icon systems!
Update 3: Fixing Desktop Performance Regression
After publishing this post, I discovered that while mobile performance improved significantly, desktop performance actually worsened. The critical CSS strategy that helped mobile was causing massive layout shifts on desktop, with a CLS score of 1.438!
Critical CSS included the grid layout change but not the actual sidebar styles. On fast desktop connections:
- Content rendered immediately in single-column layout
- When deferred CSS loaded, the sidebar appeared, shifting the main content dramatically
- This created a worse user experience on desktop than before optimization
The fix was to add essential sidebar styles to the critical CSS block:
- Added
.sidebar,.sidebar .module, and related styles inline - Added
font-display: swapfor all fonts to reduce font-loading shift - Added preconnect hint for status.lol (which is a whole 'nother thing) to reduce network latency
This is a reminder performance optimizations aren't one-size-fits-all. What helps mobile might hurt desktop, and vice versa. Test across different devices and network conditions!


Comments
To comment, please sign in with your website:
How it works: Your website needs to support IndieAuth. GitHub profiles work out of the box. You can also use IndieAuth.com to authenticate via GitLab, Codeberg, email, or PGP. Setup instructions.
Signed in as:
No comments yet. Be the first to share your thoughts!